


A little more than 2.5 million Ohioans have voted early, according to final pre-Election Day numbers from the Ohio Secretary of State’s Office.
That’s less than the nearly 3.5 million who voted early ahead of the 2020 election, which likely will be a high-water mark for early voting thanks to the coronavirus pandemic. But it’s significantly up from the nearly 1.9 million who voted early in 2016, the last presidential election conducted under more normal circumstances.
| Mail votes | In-person early votes | Total early votes | Percentage of all registered voters | |
| 2024 | 995,482 | 1,536,778 | 2,532,260 | 31.5% |
| 2020 | 2,144,504 | 1,345,625 | 3,481,225 | 43.4% |
| 2016 | 1,206,416 | 665,461 | 1,879,630 | 23.9% |
The early vote translates to around 31.3% of all registered voters, although more early votes will be recorded and counted after Election Day. That’s because there are 152,152 unreturned mail ballots. These will count as long as they were postmarked by Monday, and they arrive at their county boards of election before Saturday, under a state law that was most recently updated in 2022.
Get live election updates and results after polls close at 7:30 p.m.
This year’s early-vote numbers show a definite shift away from mail voting. Sixty percent, or almost two-thirds, of all early votes cast this year were done in person. That’s almost the opposite from previous elections, when in-person votes generally made up around one-third of the early vote.
They also show rural counties making up a larger share of the early vote than previous elections. About 43% of all early votes have been cast in rural counties, compared to 41% from urban counties. That’s a shift from 2020 (45% urban, 40% rural) and 2016 (47% urban, 38% rural), when urban counties cast more early votes than rural counties.
These numbers are consistent with Republicans placing a greater emphasis on the early vote this year. But it’s unclear to what extent this suggests overall voter turnout will be up in these areas, since it always could just mean Election Day voters are just voting early this year instead.
Cuyahoga ranks near last in early vote turnout
However, just around 25% of all registered voters in Cuyahoga County voted early, based on voter registration numbers from the primary election in March. This ranks 87th out of Ohio’s 88 counties. Cuyahoga County also is the only county where voters failed to cast more early votes than they did in 2016.
If this is a sign of reduced turnout this year in Cuyahoga County, it would be a bad sign for Ohio Democrats, since Cuyahoga County traditionally has been the party’s biggest source of votes. It also might explain why Democrats sent former President Bill Clinton to Cleveland on Monday to stump for Democratic Sen. Sherrod Brown, who’s facing a tough election challenge from Republican Bernie Moreno.
Here are the top 10 counties where early turnout is the highest. Once again, voter turnout is calculated from registration numbers from the March primary election and may have changed slightly since then.
| County Name | Voter turnout % | 2016 early vote turnout % | 2020 early vote turnout % | |
| 1 | Logan | 49.6% | 24.6% | 52% |
| 2 | Union | 48.2% | 28.9% | 58% |
| 3 | Van Wert | 44.0% | 30.3% | 53% |
| 4 | Mercer | 43.8% | 26.3% | 53% |
| 5 | Warren | 43.3% | 29.9% | 54% |
| 6 | Washington | 42.2% | 24.1% | 49% |
| 7 | Jackson | 41.9% | 24.5% | 50% |
| 8 | Putnam | 41.8% | 22.8% | 51% |
| 9 | Hocking | 41.7% | 26.1% | 51% |
| 10 | Medina | 41.6% | 29.7% | 50% |
Here are the bottom 10:
| 1 | Lawrence | 24.1% | 17.5% | 33% |
| 2 | Cuyahoga | 25.0% | 26.0% | 42% |
| 3 | Ashtabula | 26.4% | 18.2% | 38% |
| 4 | Lucas | 26.9% | 18.0% | 32% |
| 5 | Hamilton | 27.2% | 19.3% | 42% |
| 6 | Columbiana | 27.5% | 15.8% | 34% |
| 7 | Allen | 27.6% | 18.9% | 36% |
| 8 | Montgomery | 27.7% | 22.7% | 42% |
| 9 | Franklin | 27.7% | 26.8% | 42% |
| 10 | Sandusky | 27.8% | 18.2% | 42% |
Finally, here’s what early vote turnout looks like in Ohio’s 10 largest counties. They are ranked from most to fewest registered voters:
| County Name | Voter turnout % | 2016 early vote turnout % | 2020 early vote turnout % | |
| 1 | Franklin | 27.7% | 26.8% | 42% |
| 2 | Cuyahoga | 25.0% | 26.0% | 42% |
| 3 | Hamilton | 27.2% | 19.3% | 42% |
| 4 | Summit | 28.3% | 23.3% | 40% |
| 5 | Montgomery | 27.7% | 22.7% | 42% |
| 6 | Lucas | 26.9% | 18.0% | 32% |
| 7 | Butler | 32.8% | 23.7% | 44% |
| 8 | Stark | 30.6% | 21.6% | 41% |
| 9 | Lorain | 32.4% | 26.2% | 45% |
| 10 | Warren | 43.3% | 29.9% | 54% |
Outstanding absentees may delay results of close races
The 152,152 outstanding absentee ballots equal about 2.5% of the vote, assuming turnout looks like it did in previous election years.
These late-arriving ballots conceivably could lead to delayed results in the state’s most competitive statewide election – the race between: Democratic U.S. Sen. Sherrod Brown’s reelection contest against Republican challenger Bernie Moreno – if it actually turns out to be close.
Here are where there are the most outstanding absentee ballots.
County Name Unreturned absentees 1 Cuyahoga 21,922 2 Franklin 17,721 3 Hamilton 12,243 4 Montgomery 8,769 5 Summit 8,013 6 Lucas 6,038 7 Lorain 4,855 8 Butler 4,680 9 Delaware 4,574 10 Stark 4,241 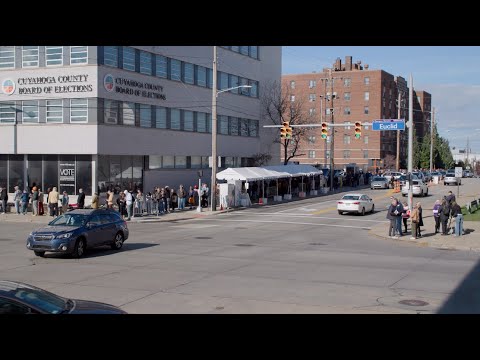


Here is a table of what the early vote looks like in all 88 Ohio counties, as a percentage of all registered voters, and what that number looked like in the previous presidential elections. Source: Ohio Secretary of State’s Office data
| County Name | All early votes counted 11/4 | Voter turnout % | 2016 early vote turnout % | 2020 early vote turnout % |
|---|---|---|---|---|
| Adams | 6,857 | 39.4% | 21.9% | 42% |
| Allen | 18,293 | 27.6% | 18.9% | 36% |
| Ashland | 13,360 | 38.6% | 24.0% | 48% |
| Ashtabula | 15,991 | 26.4% | 18.2% | 38% |
| Athens | 11,235 | 29.3% | 22.7% | 41% |
| Auglaize | 11,053 | 34.2% | 19.3% | 44% |
| Belmont | 15,124 | 34.2% | 29.9% | 43% |
| Brown | 9,548 | 32.6% | 18.3% | 41% |
| Butler | 83,525 | 32.8% | 23.7% | 44% |
| Carroll | 5,542 | 30.7% | 21.3% | 42% |
| Champaign | 10,325 | 38.9% | 24.1% | 45% |
| Clark | 29,356 | 33.8% | 25.0% | 45% |
| Clermont | 46,899 | 31.9% | 24.0% | 38% |
| Clinton | 9,901 | 36.2% | 22.7% | 44% |
| Columbiana | 17,883 | 27.5% | 15.8% | 34% |
| Coshocton | 8,853 | 40.0% | 27.4% | 49% |
| Crawford | 9,375 | 33.8% | 22.8% | 47% |
| Cuyahoga | 218,805 | 25.0% | 26.0% | 42% |
| Darke | 12,754 | 36.9% | 23.4% | 46% |
| Defiance | 10,311 | 39.0% | 22.0% | 50% |
| Delaware | 65,310 | 40.5% | 31.5% | 57% |
| Erie | 19,344 | 36.1% | 24.8% | 43% |
| Fairfield | 40,824 | 37.2% | 28.8% | 51% |
| Fayette | 5,797 | 33.9% | 21.9% | 42% |
| Franklin | 245,477 | 27.7% | 26.8% | 42% |
| Fulton | 9,943 | 34.0% | 19.2% | 43% |
| Gallia | 6,122 | 32.8% | 19.8% | 43% |
| Geauga | 25,891 | 38.1% | 26.8% | 51% |
| Greene | 48,739 | 40.5% | 26.9% | 45% |
| Guernsey | 7,659 | 31.8% | 20.7% | 43% |
| Hamilton | 163,290 | 27.2% | 19.3% | 42% |
| Hancock | 19,260 | 37.5% | 23.8% | 45% |
| Hardin | 5,728 | 32.4% | 23.2% | 42% |
| Harrison | 2,734 | 27.9% | 20.3% | 38% |
| Henry | 7,326 | 36.5% | 21.7% | 46% |
| Highland | 9,250 | 33.9% | 23.0% | 38% |
| Hocking | 7,575 | 41.7% | 26.1% | 51% |
| Holmes | 6,190 | 34.8% | 21.2% | 45% |
| Huron | 12,254 | 33.6% | 23.2% | 44% |
| Jackson | 8,566 | 41.9% | 24.5% | 50% |
| Jefferson | 14,063 | 30.4% | 20.2% | 38% |
| Knox | 16,841 | 39.3% | 27.8% | 47% |
| Lake | 58,059 | 35.7% | 28.0% | 51% |
| Lawrence | 10,220 | 24.1% | 17.5% | 33% |
| Licking | 47,182 | 37.3% | 26.3% | 50% |
| Logan | 15,957 | 49.6% | 24.6% | 52% |
| Lorain | 71,437 | 32.4% | 26.2% | 45% |
| Lucas | 79,881 | 26.9% | 18.0% | 32% |
| Madison | 10,535 | 39.8% | 25.1% | 48% |
| Mahoning | 48,608 | 30.3% | 24.5% | 42% |
| Marion | 15,038 | 38.6% | 25.2% | 47% |
| Medina | 54,886 | 41.6% | 29.7% | 50% |
| Meigs | 4,464 | 30.3% | 16.7% | 42% |
| Mercer | 12,919 | 43.8% | 26.3% | 53% |
| Miami | 30,732 | 40.0% | 28.3% | 49% |
| Monroe | 3,220 | 34.9% | 29.2% | 44% |
| Montgomery | 100,940 | 27.7% | 22.7% | 42% |
| Morgan | 3,500 | 38.5% | 26.6% | 49% |
| Morrow | 8,340 | 33.1% | 19.8% | 41% |
| Muskingum | 19,455 | 36.1% | 25.4% | 44% |
| Noble | 3,123 | 39.1% | 31.5% | 54% |
| Ottawa | 10,949 | 36.0% | 24.3% | 44% |
| Paulding | 4,700 | 37.5% | 25.0% | 45% |
| Perry | 7,632 | 33.7% | 23.0% | 42% |
| Pickaway | 12,822 | 34.7% | 22.0% | 43% |
| Pike | 6,714 | 37.9% | 27.1% | 50% |
| Portage | 32,971 | 30.5% | 21.4% | 44% |
| Preble | 8,995 | 31.6% | 18.6% | 40% |
| Putnam | 9,919 | 41.8% | 22.8% | 51% |
| Richland | 29,862 | 36.3% | 24.5% | 46% |
| Ross | 16,647 | 36.2% | 25.2% | 46% |
| Sandusky | 11,087 | 27.8% | 18.2% | 42% |
| Scioto | 13,449 | 30.1% | 20.3% | 41% |
| Seneca | 10,011 | 29.1% | 15.6% | 41% |
| Shelby | 11,990 | 36.6% | 19.7% | 45% |
| Stark | 75,773 | 30.6% | 21.6% | 41% |
| Summit | 105,356 | 28.3% | 23.3% | 40% |
| Trumbull | 39,820 | 29.5% | 21.6% | 43% |
| Tuscarawas | 17,101 | 29.3% | 24.3% | 35% |
| Union | 22,056 | 48.2% | 28.9% | 58% |
| Van Wert | 8,929 | 44.0% | 30.3% | 53% |
| Vinton | 2,860 | 34.1% | 21.7% | 41% |
| Warren | 75,062 | 43.3% | 29.9% | 54% |
| Washington | 17,842 | 42.2% | 24.1% | 49% |
| Wayne | 24,242 | 33.2% | 21.0% | 42% |
| Williams | 7,974 | 32.3% | 18.1% | 45% |
| Wood | 30,374 | 32.7% | 19.2% | 43% |
| Wyandot | 5,494 | 36.6% | 15.9% | 44% |